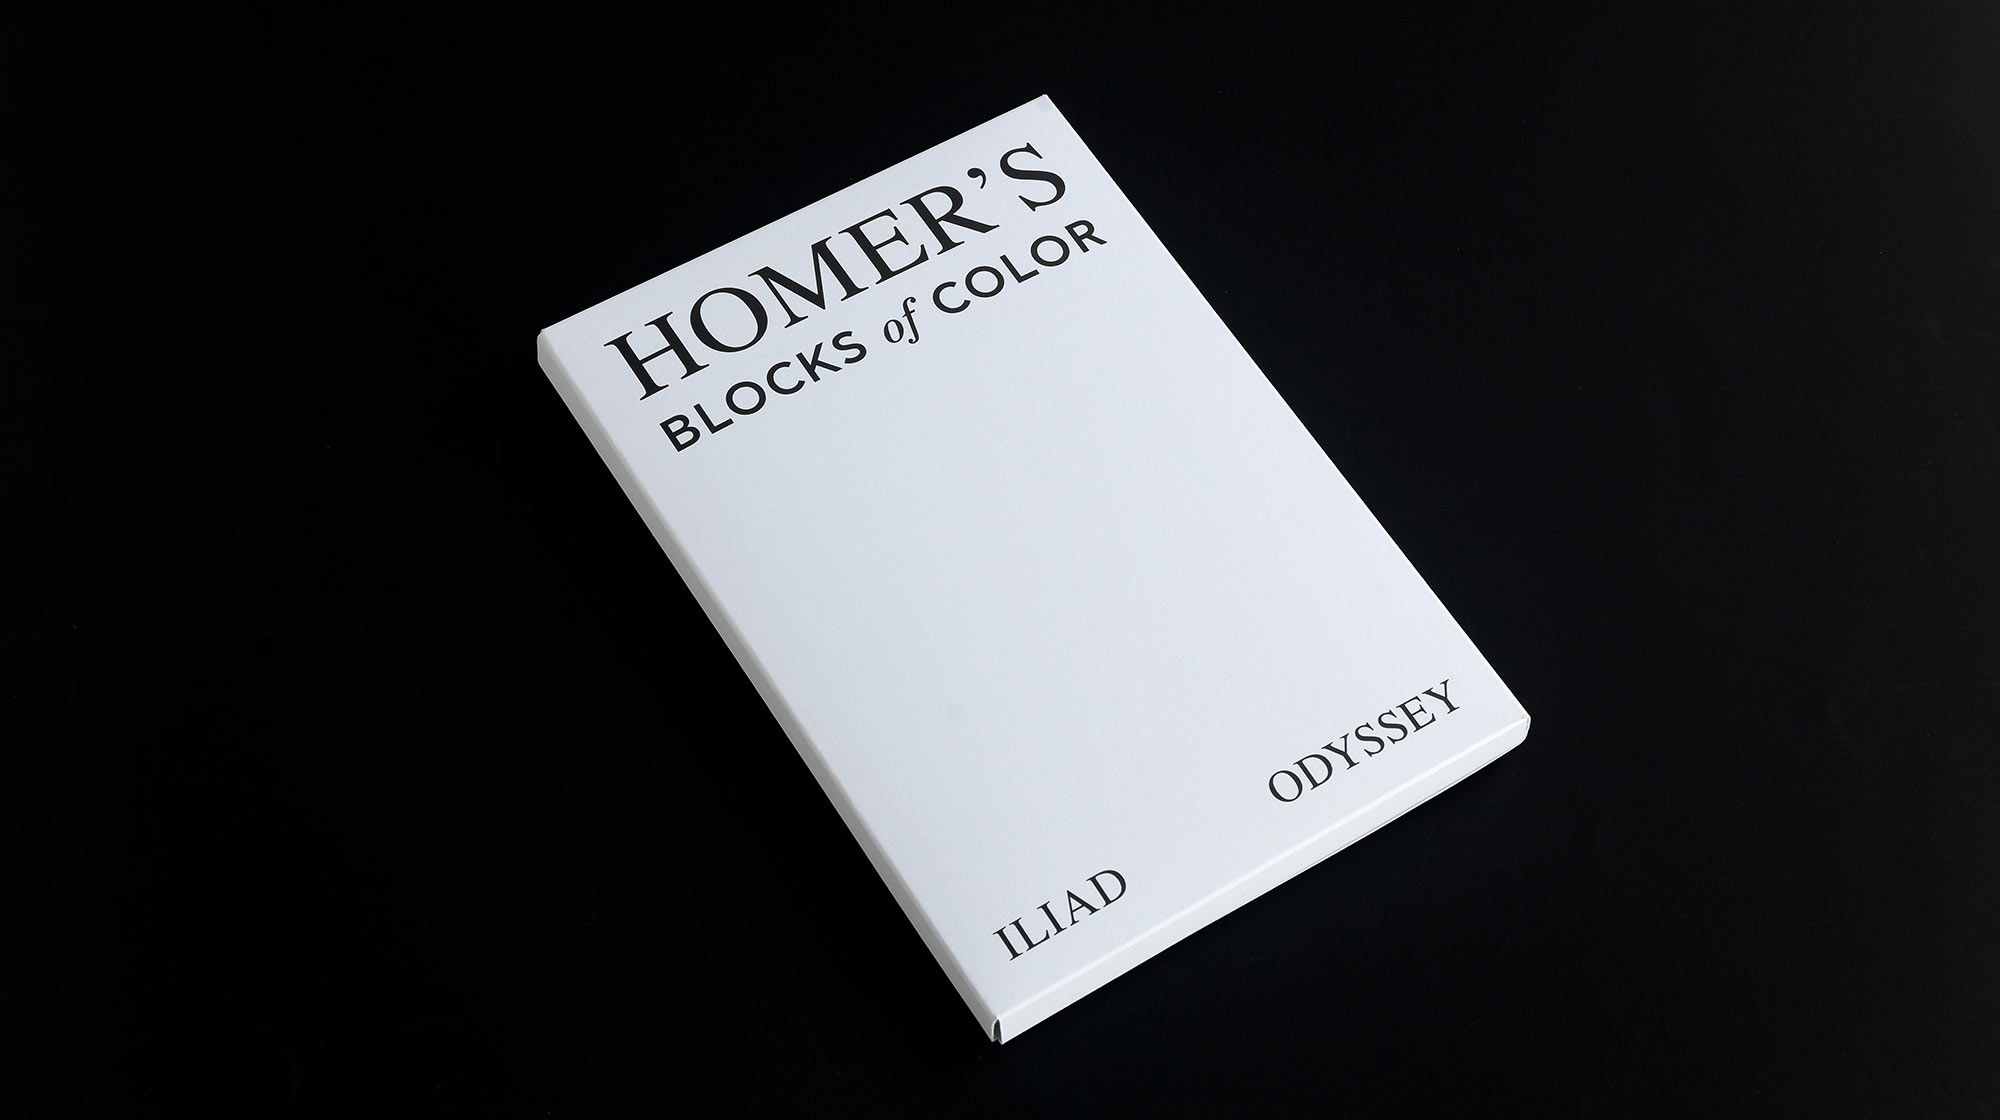

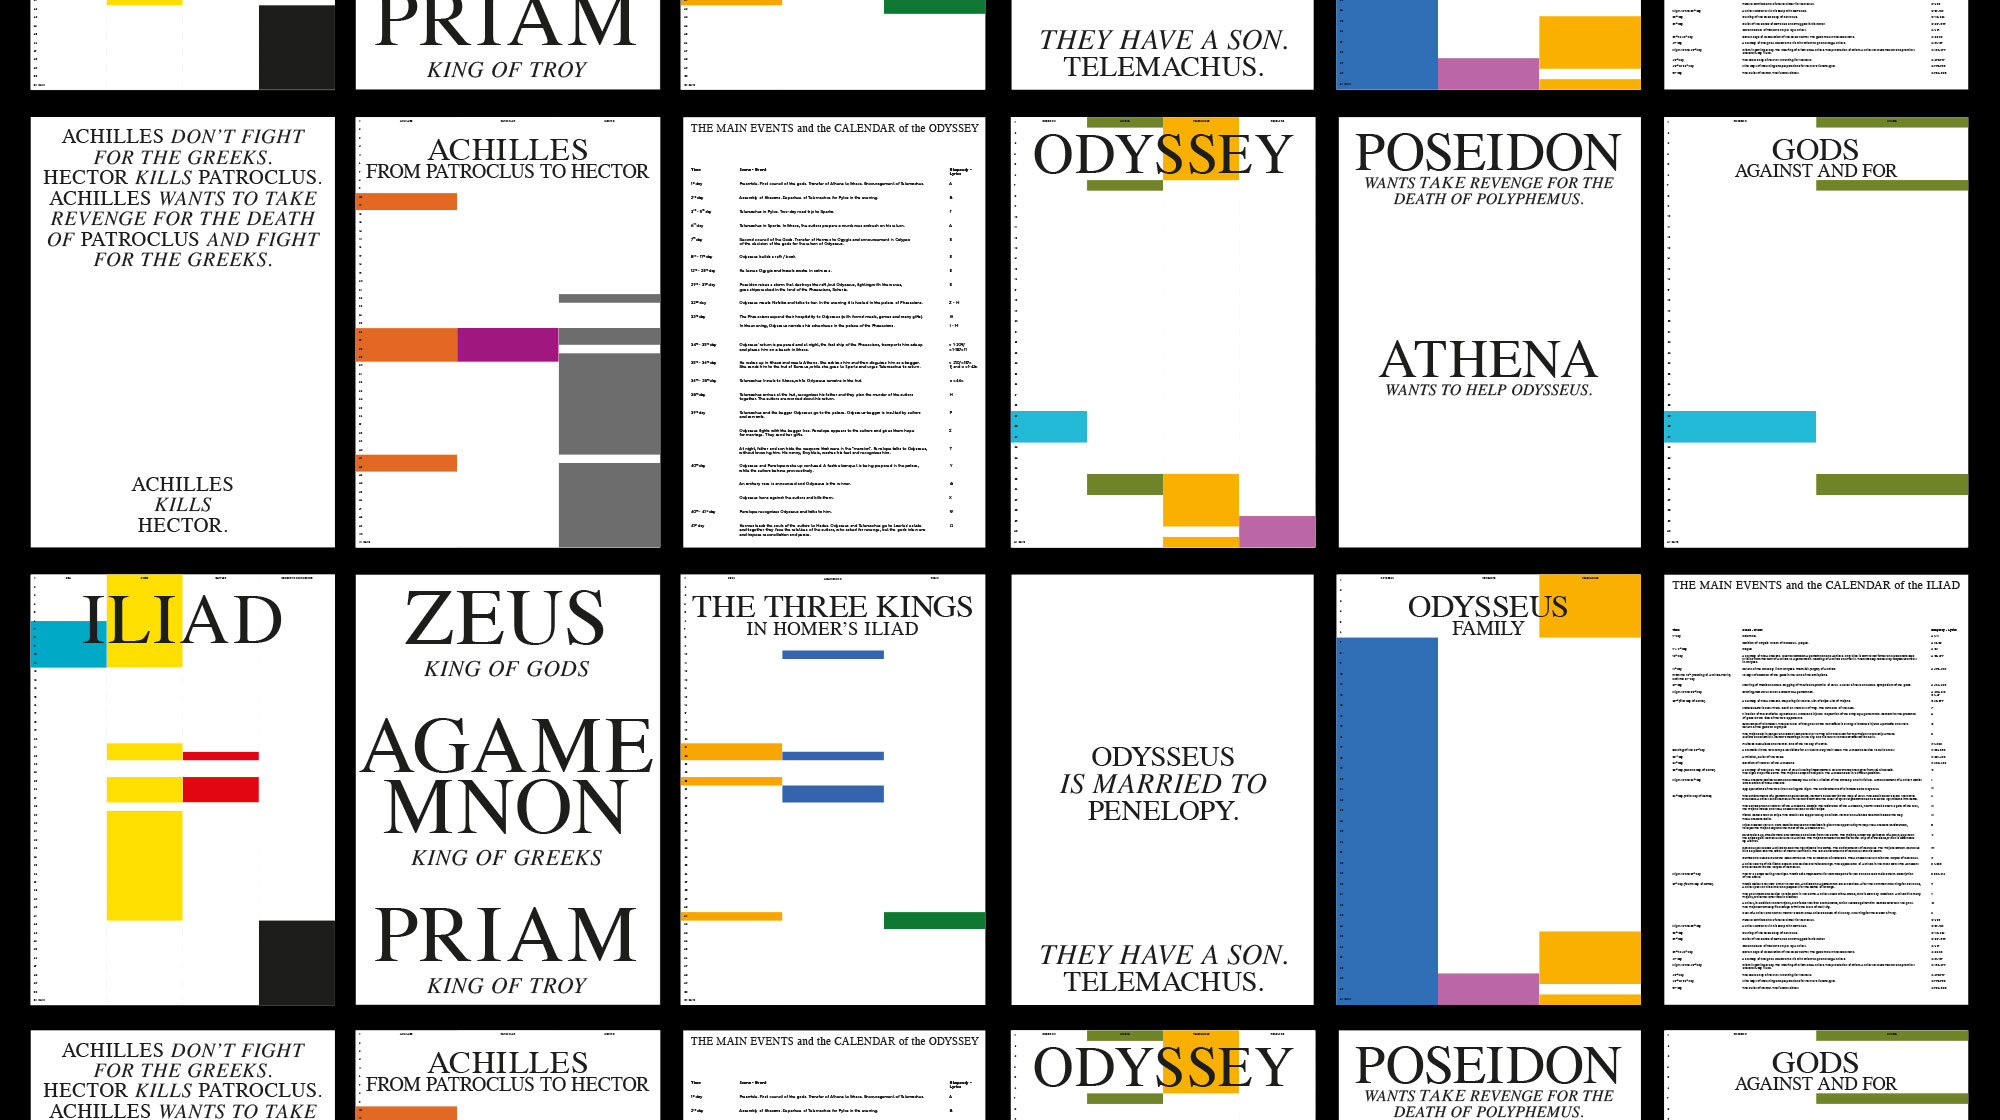
Homer’s Blocks of Color is an exploration of different ways to chart a story visually. For this study, we referenced Homer’s two most iconic books, not only due to the plurality in characters and plot, but also due to the divine element in the narration.
The exploration led us to develop a visual system based on three basic guides.
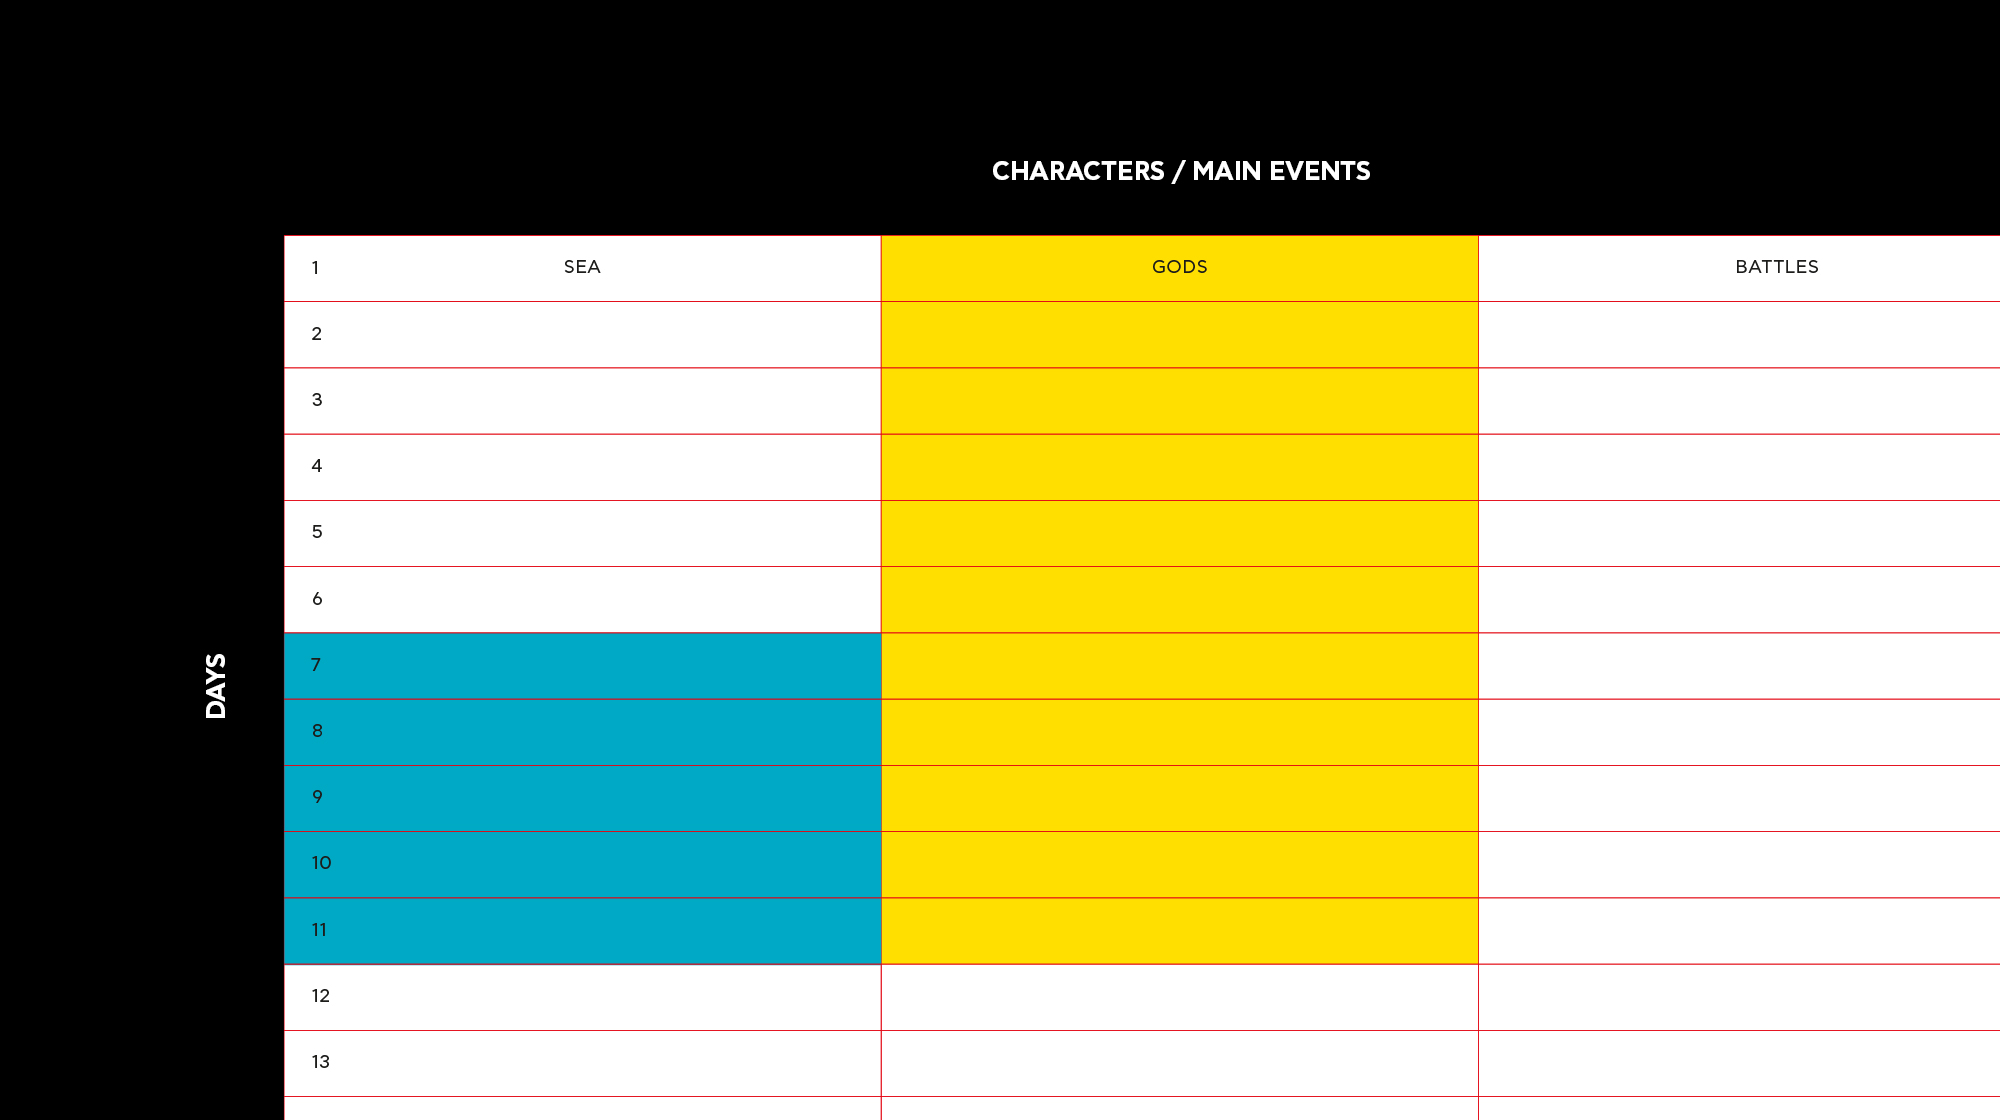
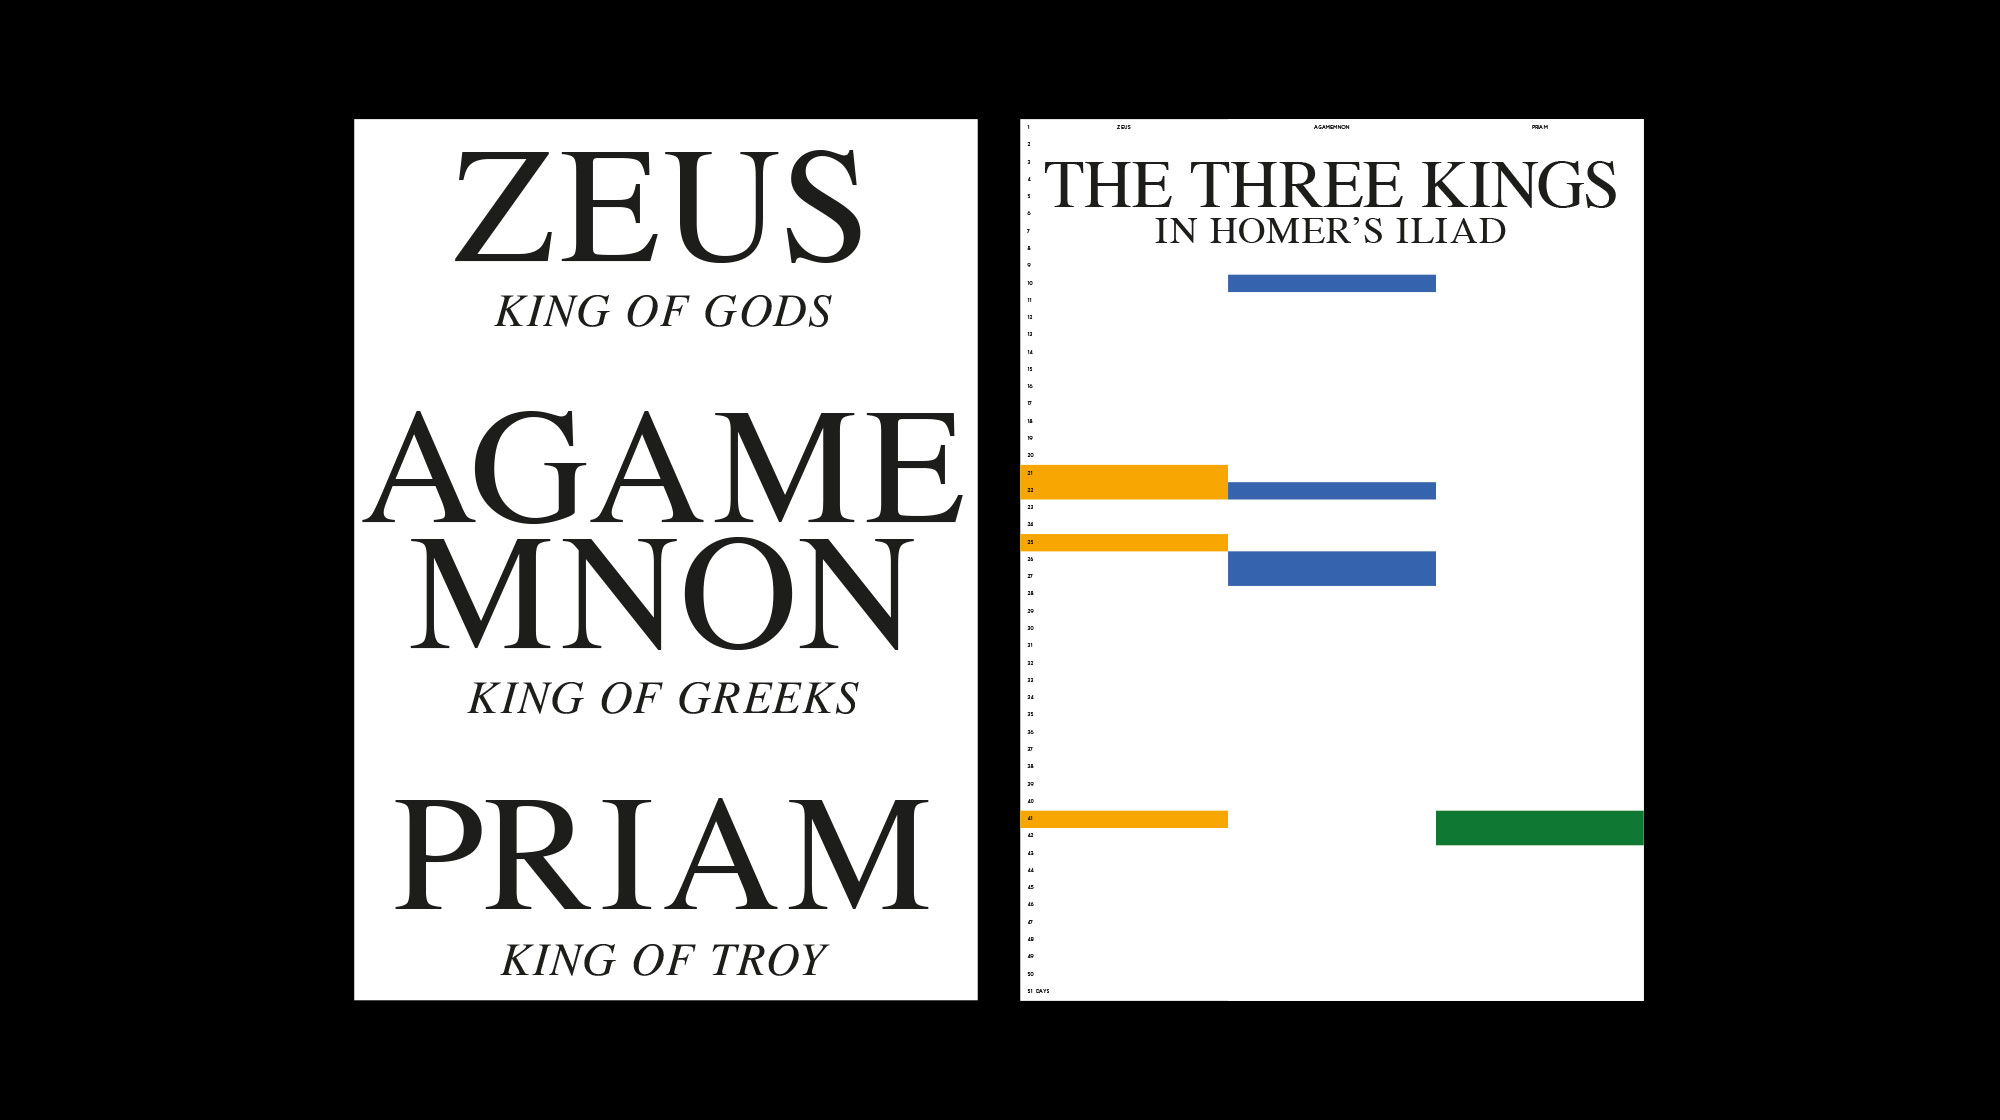
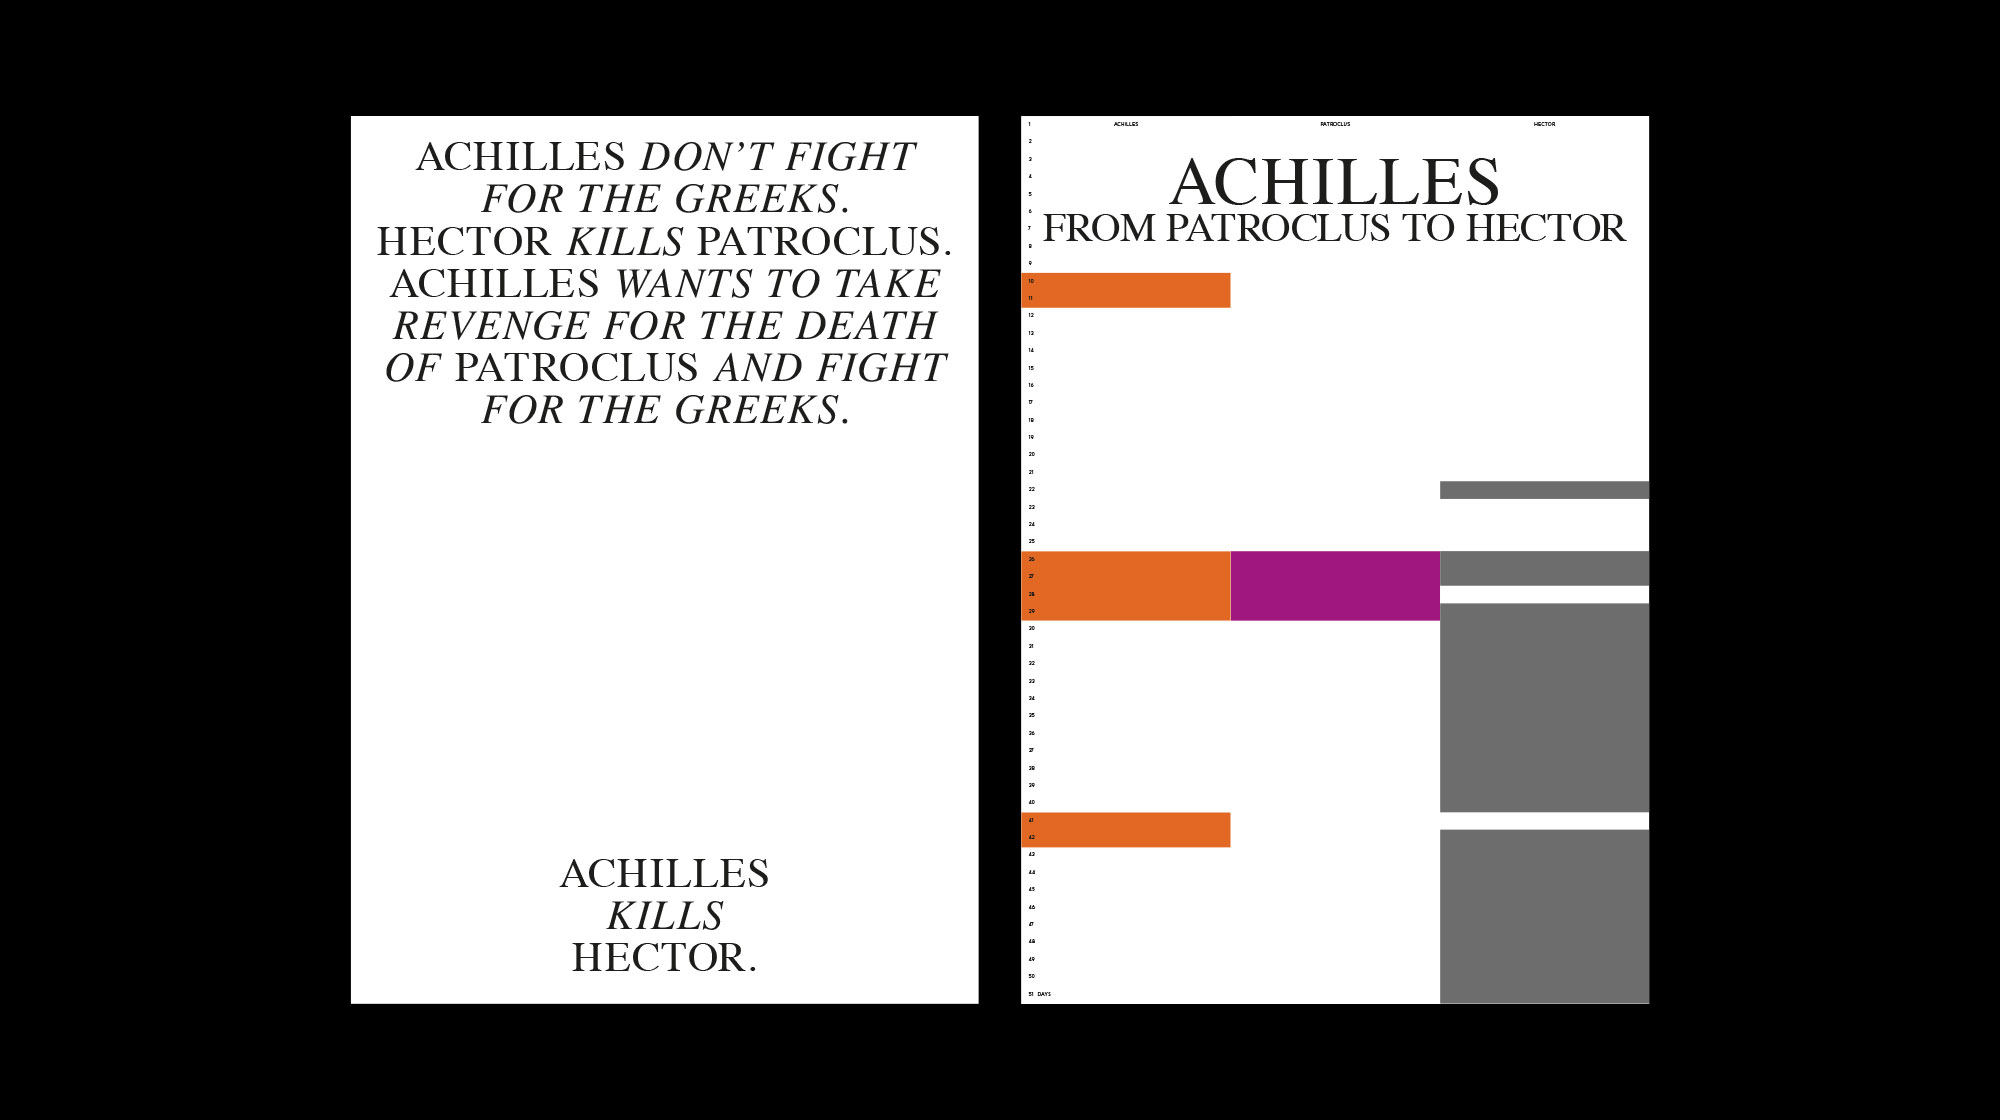
For Guide 1 we capture the timeline of the novel – in this case, the days on which the narration of each book takes place. (y axis of the chart)
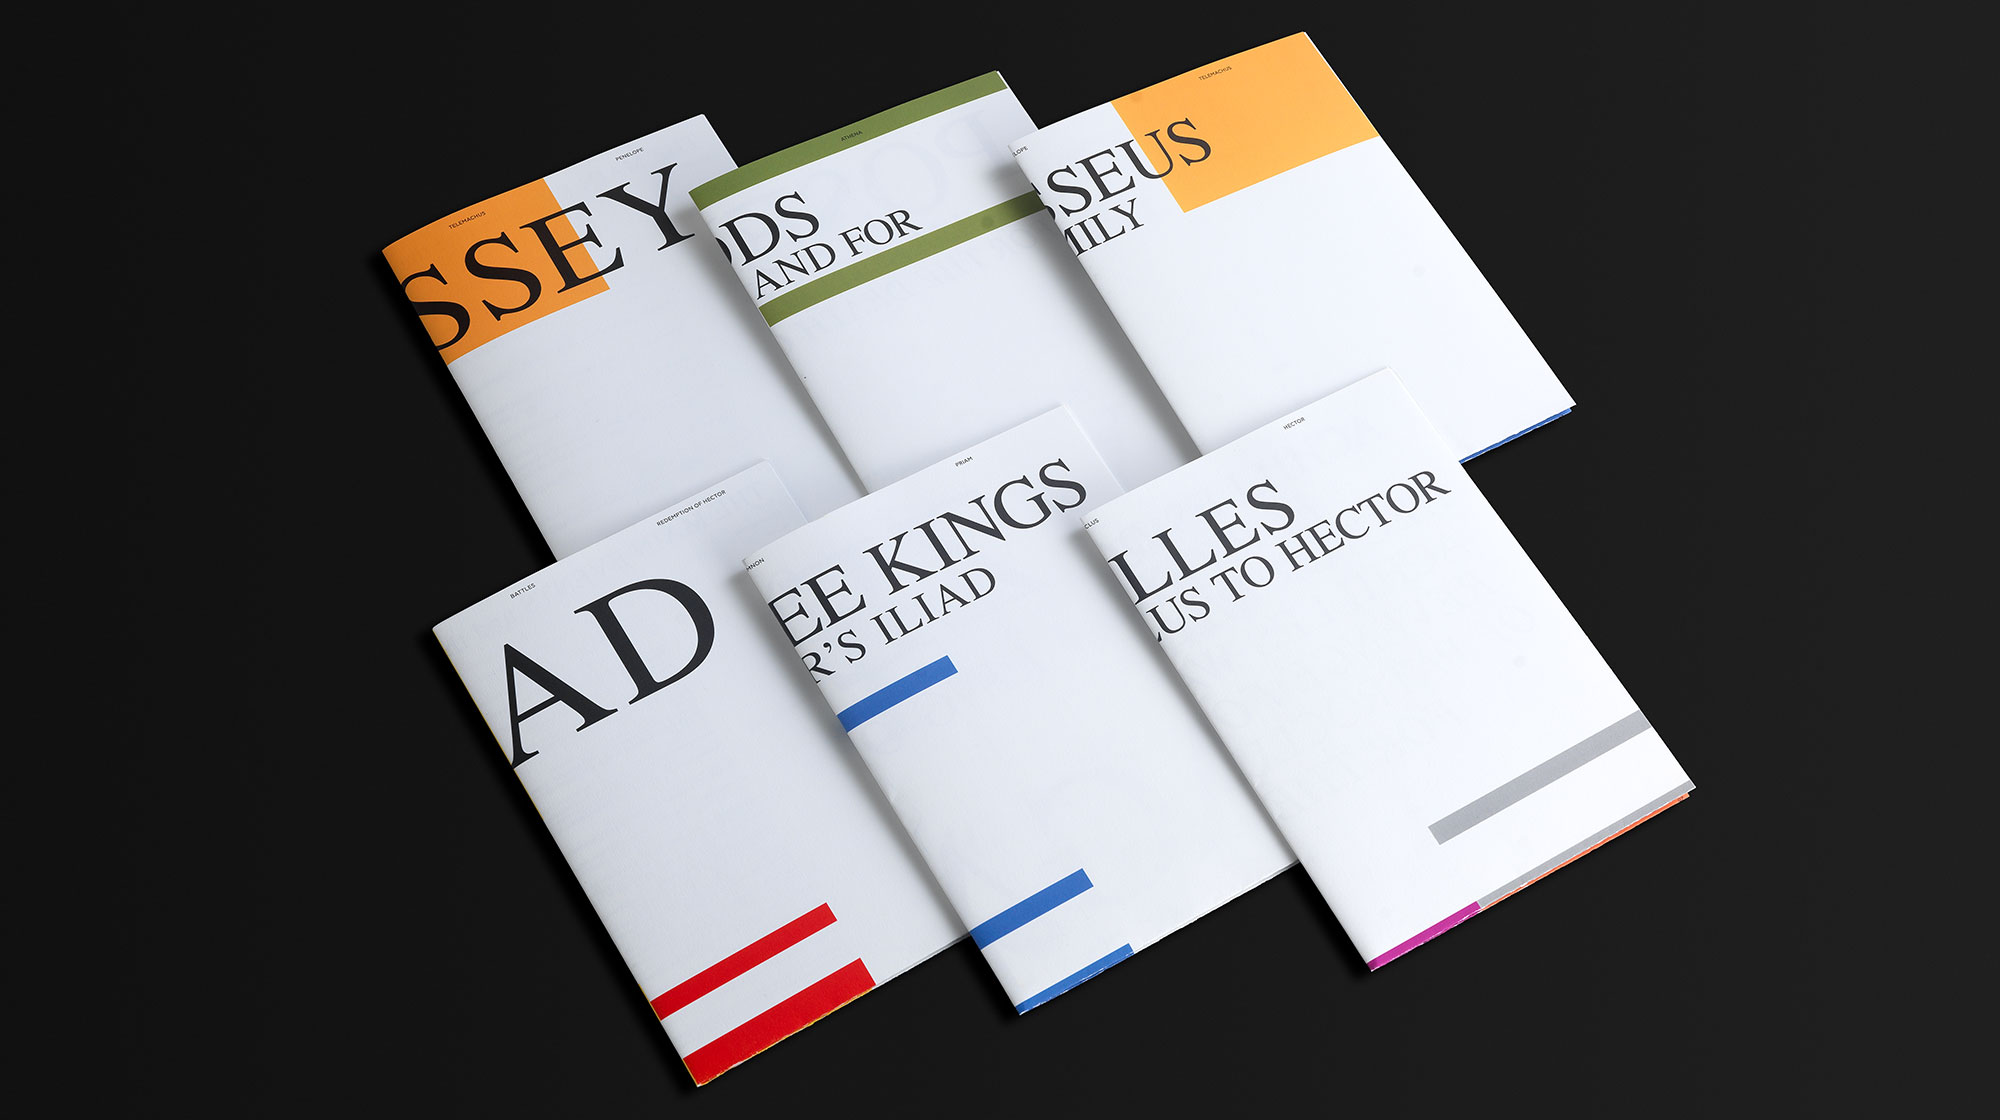
For Guide 2 we select characters who play a leading role in the development of the story, as well as things and incidents that affect them. After that we define one color block for each. (x axis of the chart)
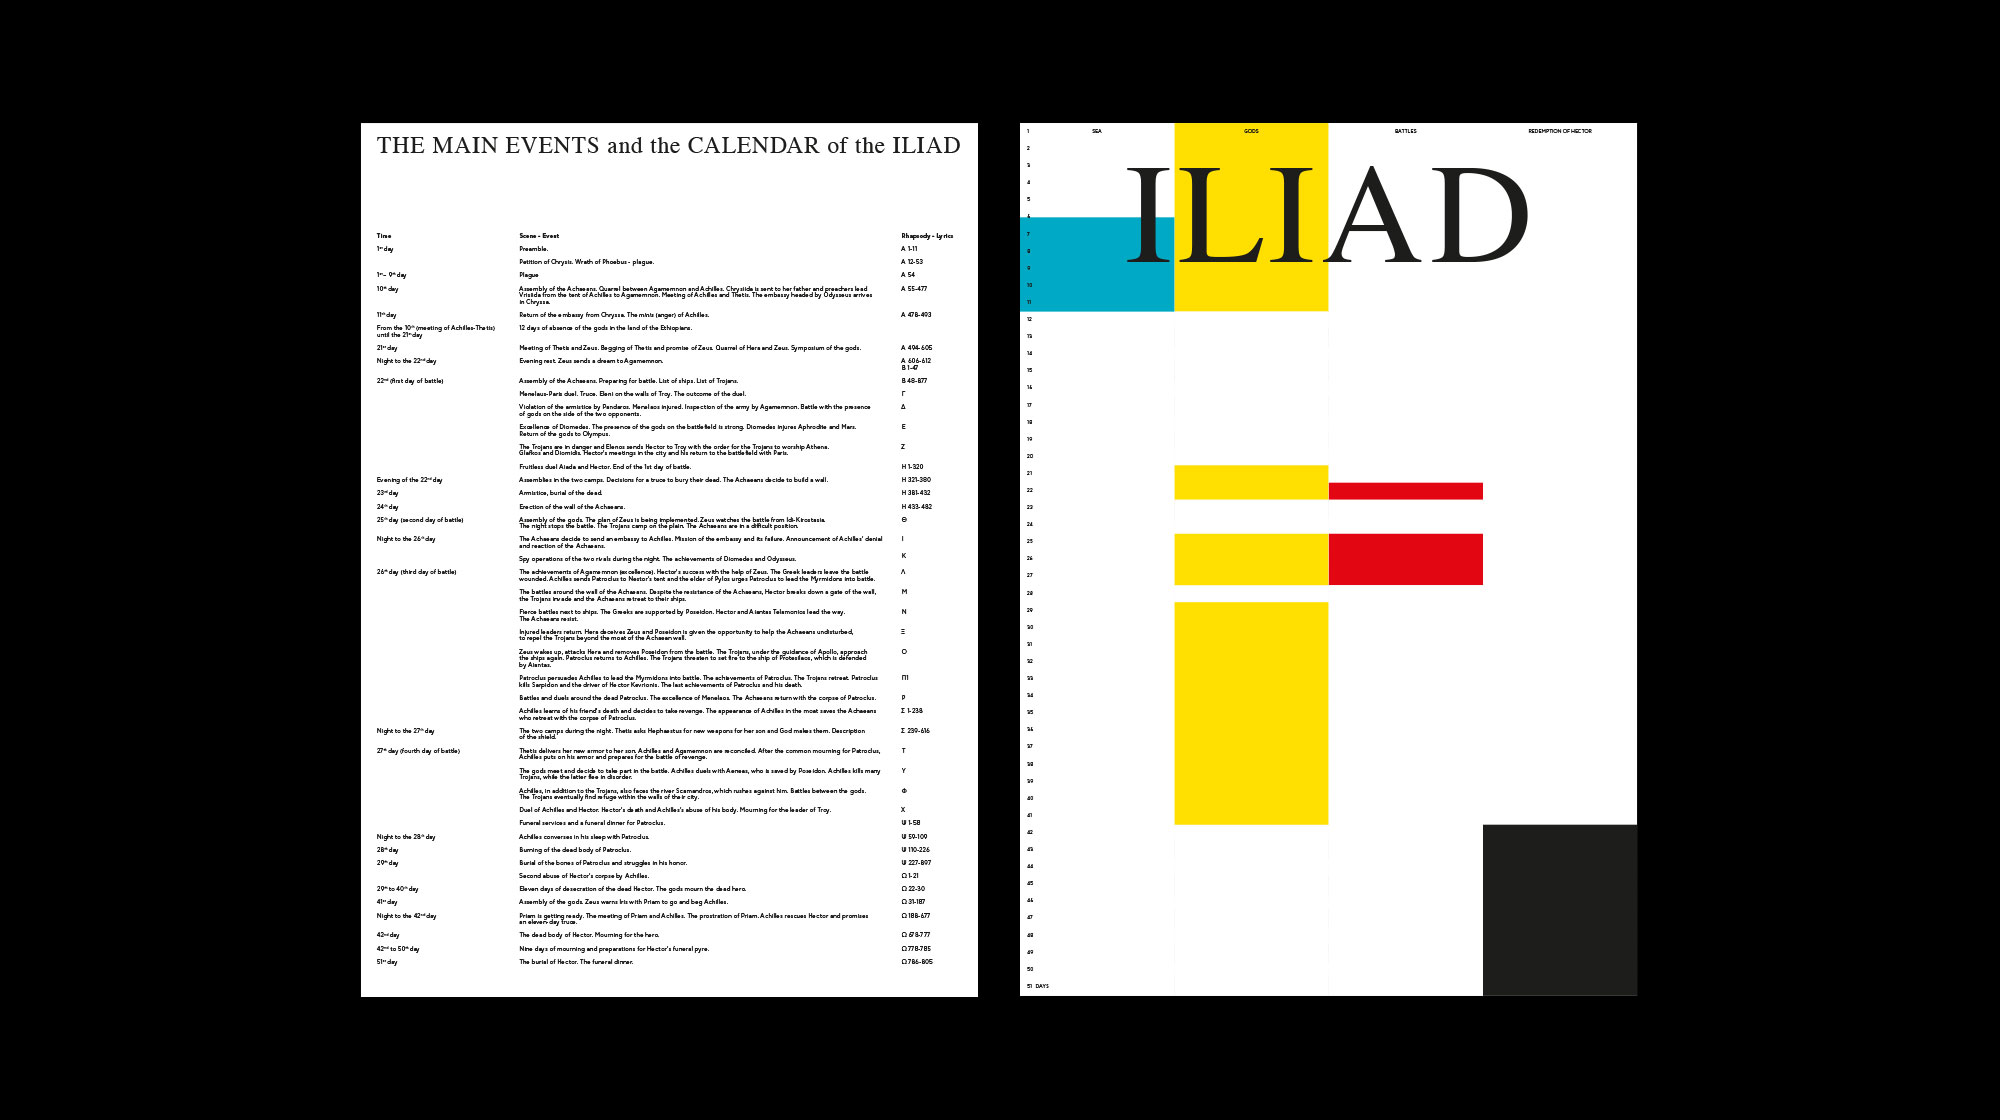
For Guide 3 we place each character, thing or incident on the story’s timeline and match them in relevant combinations. (chart bars)
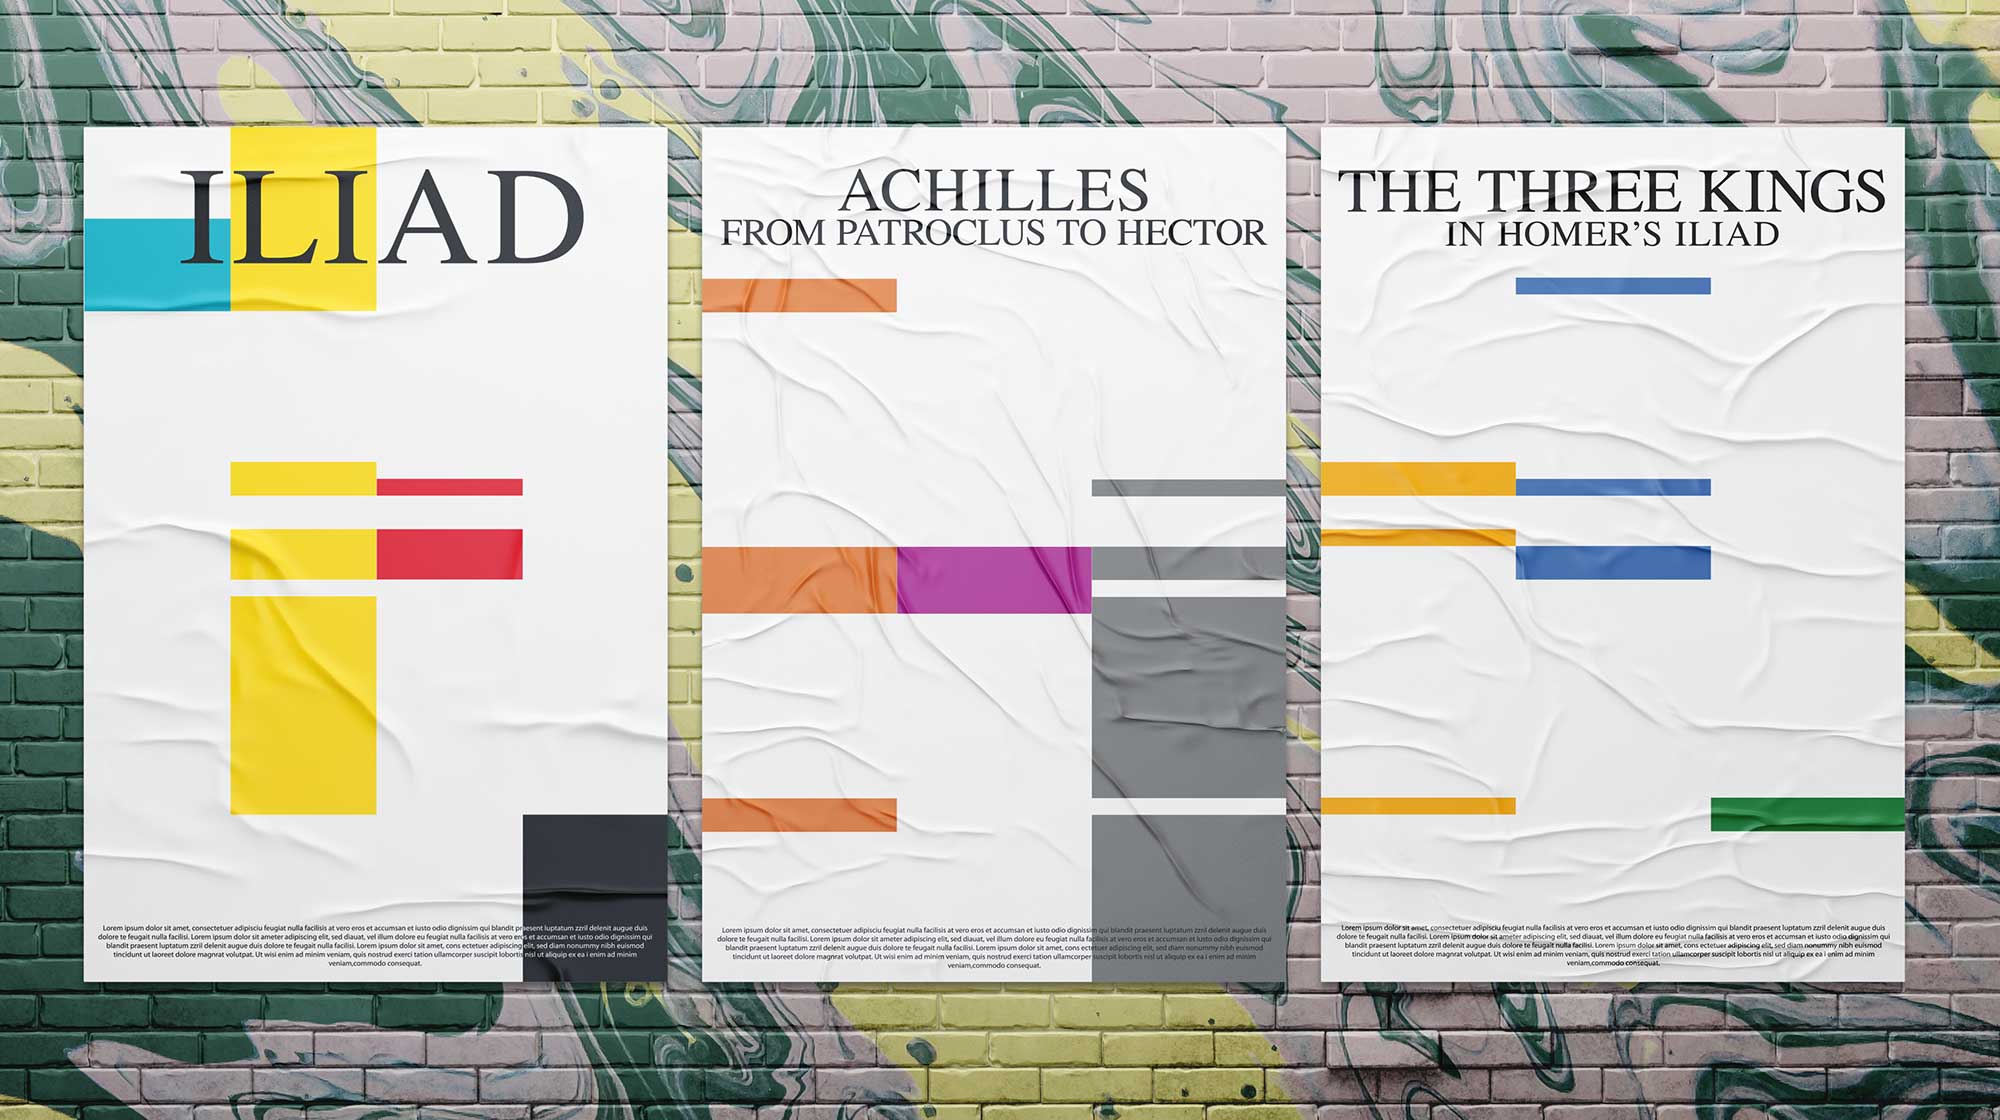
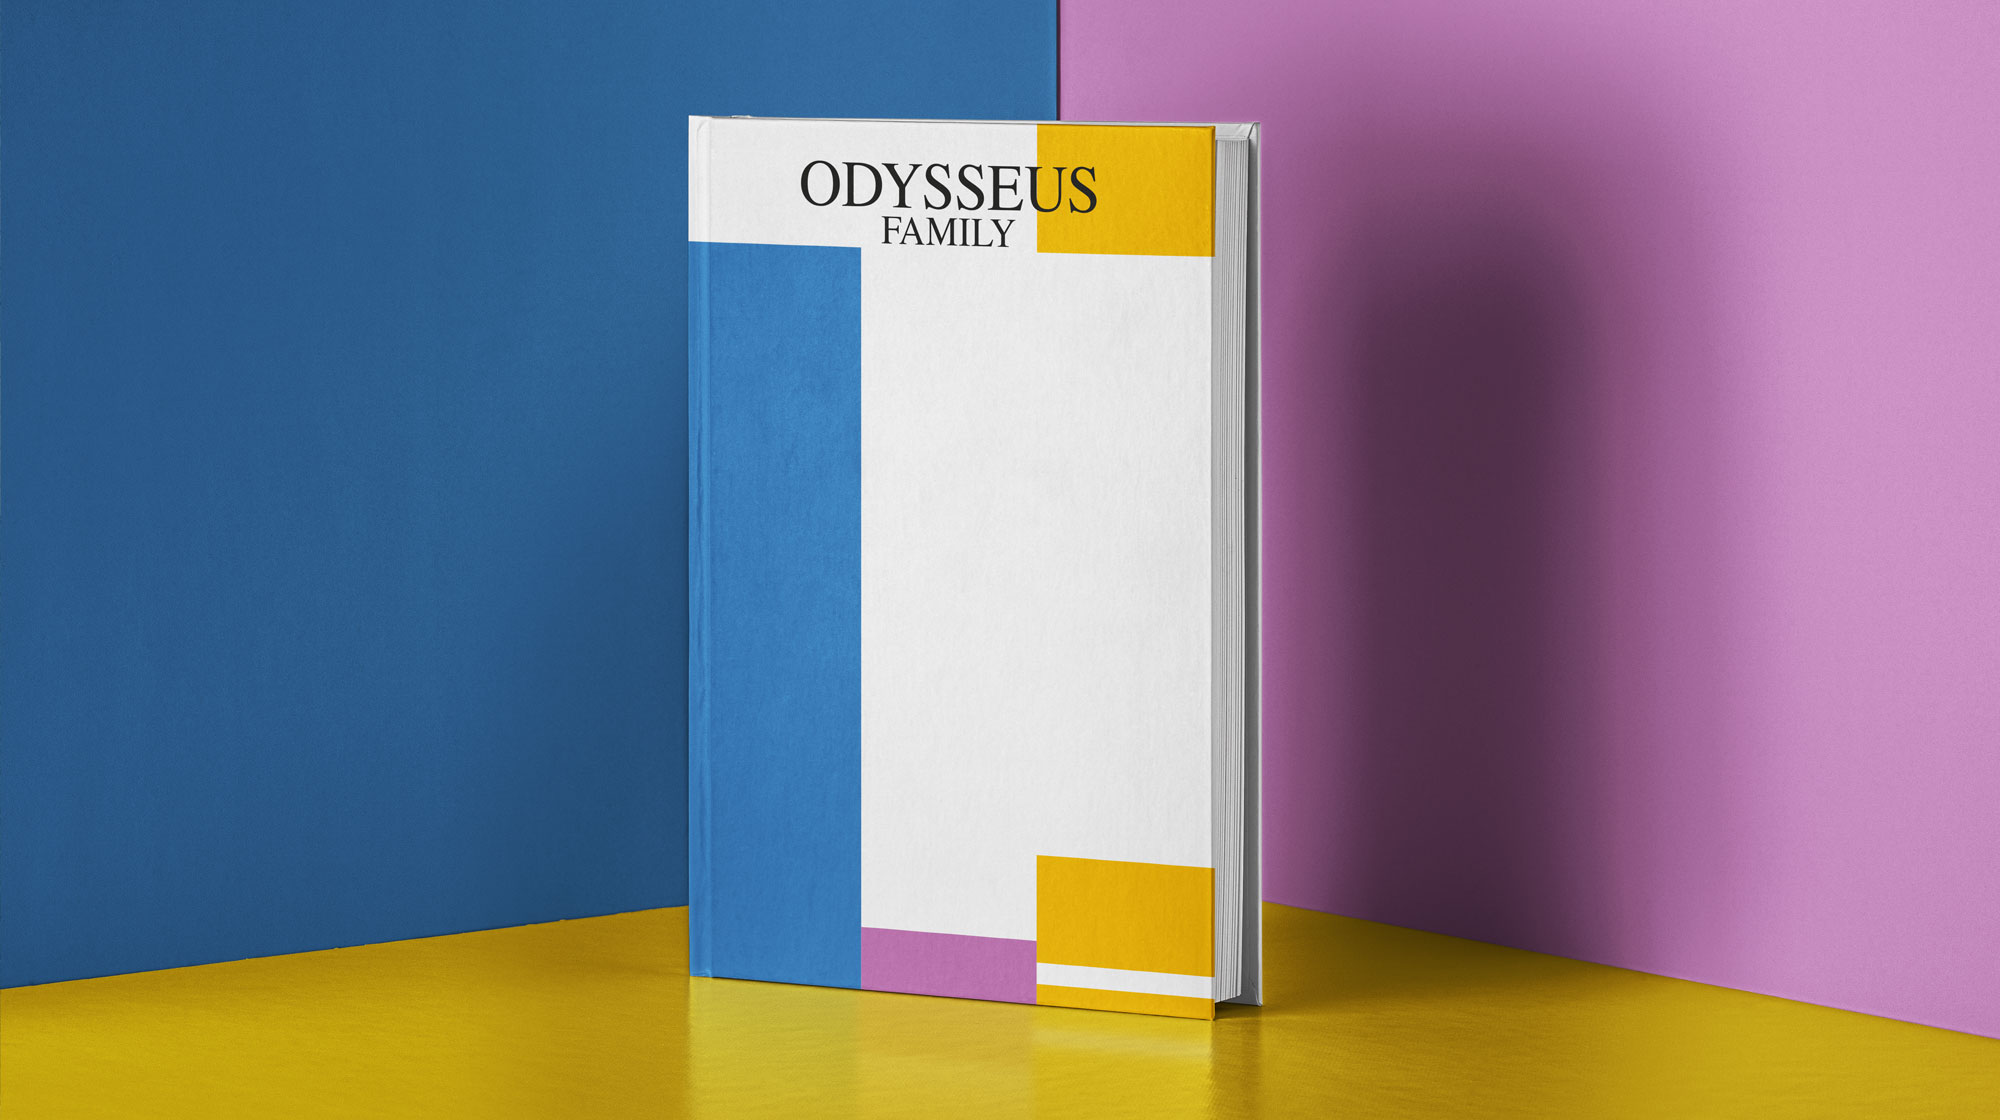
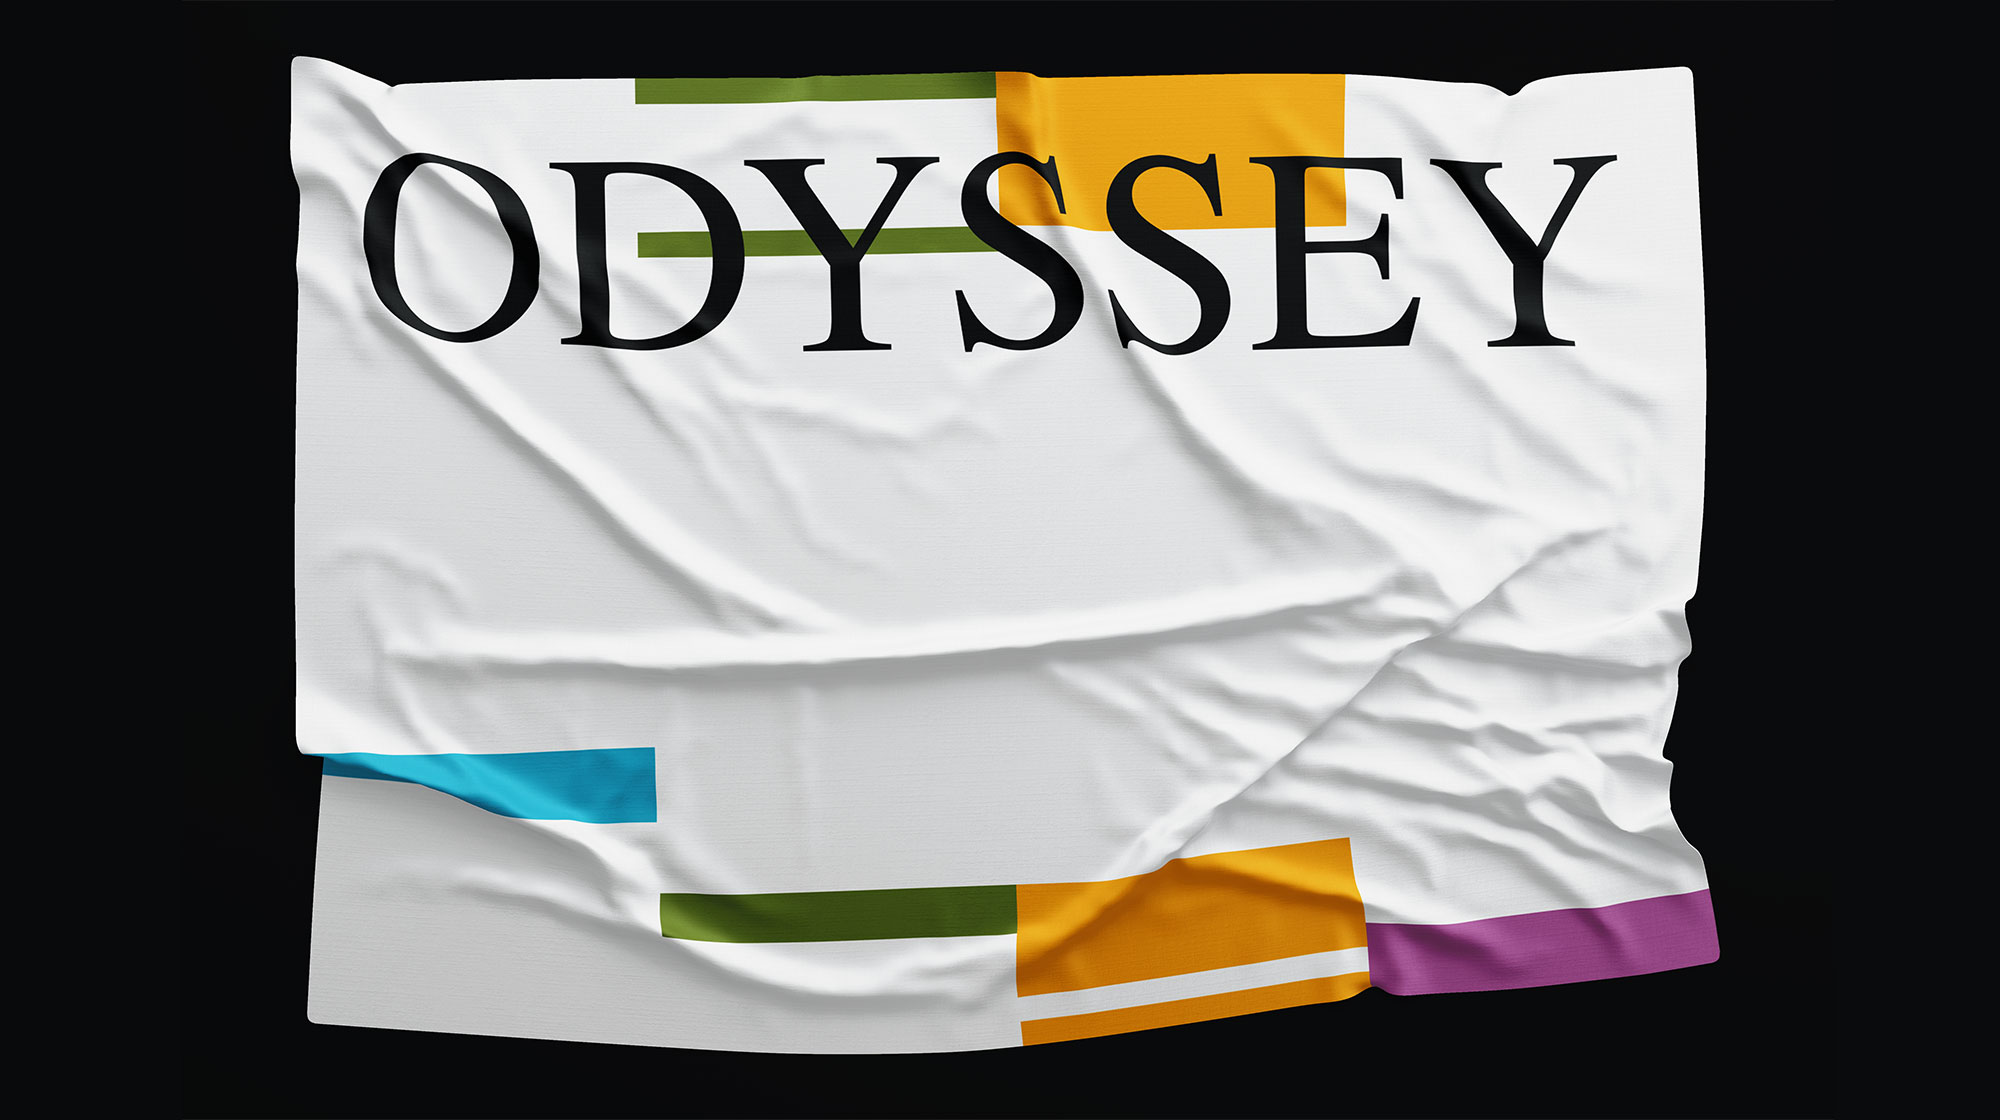
The outcome is a system that generates graphics based on the plot of each book. The system can generate visuals that can be applied on posters of theatrical plays, on covers of new books based on Homer’s work, on product labels and more. The method of this system is dynamic, making it applicable to other novels and books based on their unique content.
Get in touch!